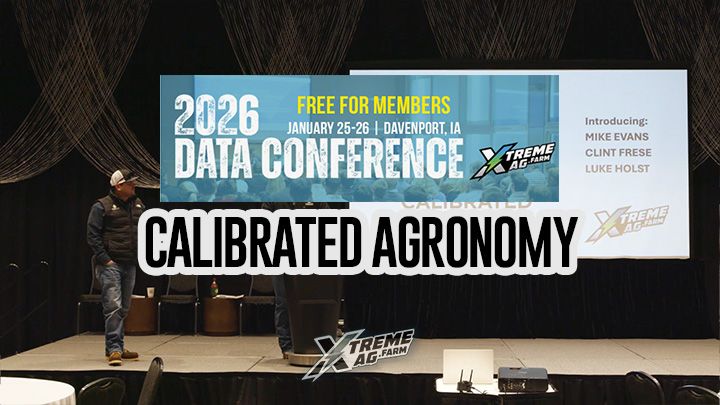
Farming Video | Fighting Knowledge Extinction With Calibrated Agronomy
At the 2026 XtremeAg Data Conference, Calibrated Agronomy breaks down plant sap, soil health, and how to fix problems—not just treat symptoms.
Get the full picture—download the complete data booklet and watch more videos from the XtremeAg Data Conference here:
https://www.xtremeag.farm/trial-data-and-portal
Thanks for coming. Uh, we are the, uh, finale here, so we're holding you up to lunch as the cliche statement says. But, uh, uh, we're excited at calibrated agronomy here. Um, obviously myself, I work really close with Kelly, um, at his farm, but to be able to bring the other teammates in here, Clint, Luke and, and Jared from Idaho, um, we're excited to help or extreme ag going into 2026. So we're gonna kind of work on explaining who we are. There's the four of us, uh, put there. So you can see who Jared is, the short guy from Idaho, so I can make fun of him 'cause he's not here. So, um, we're, you know, just more agronomists. Um, and we just, uh, have a lot of like-minded ideas. So, you know, why did we form? Um, we formed about a year ago clinic. Is that right? Yeah, over a year ago. Um, and we came up this thought of knowledge extinction, you know, as the transition even on the farm. And it's happened at the ag retail level in the industry. Um, the old guard a little bit is going out. We got new flux and there's a lot of knowledge that tends to dissipate out of the industry. Um, we want to keep that going. So knowledge extinction, uh, we're a team of like-minded people where you have sim similar philosophies, similar, similar goals. So we're really focused on a lot of things and really have a passion for it. Um, and that, that really we've come up with the term of agronomic dysfunctions. You know, feel like the industry is really good at treating symptoms. You know, we see weed kill it, right? So excellent at that. Now why is that weed there and why did it show up? That's kind of our, where our brain goes, right? So that's what we try to do. Um, and at the end of the day, we're trying to make difference for you people out here. Um, so that's really why we formed and we wanted to work together. Um, you know, obviously Clinton, Illinois, Clinton, liquor, Illinois. We're at Iowa, Jersey, Idaho. So we get a lot of diversity of different operations, different environments that we work in. So that is another strength that we feel like we brought together as a group. Um, my clicker stopped working. There we go. So what do we do? Um, really focused on research. Um, you know, let's say find that dysfunction. Let's build a solution, figure out how to fix it, right? So that, that's probably the number one thing we do. Uh, calibrate agronomy is working out different research protocols and things that we, uh, find to fix. Um, battery, where do I point the statement? So you here, so data collection and then turning that data into useful thing. So analytical tools, um, we'll talk about that a little bit later here. Like kind of a, a vision of that, um, with what? It's Okay, you wanna use this? Ah, that's fine. I gotta have this here too. So, uh, and then education, we'll talk about this a little bit too, as a foundational education and advanced what we call advanced agronomy. So, uh, we're really working on that piece to help you guys be better growers. Um, and we work through dealers too to help them service there straight areas. And then, and obviously that's one of the reasons we partnered up with, with the extreme ag, um, to help facilitate all this. Uh, where are we located? Our main places are in Illinois and Iowa. Like I said, here's a couple pictures of where they're at, kind of what we do. We're both working on expansion product projects. Uh, Clint's working on a big warehouse, putting a new car, um, and we're working on a dry fertilizer shed to, uh, help better serve some things. Um, so we talked about going back to the basics and uh, kind of came through this through this last year. We do a lot of trials, beat our head against the ball. A lot of times a lot of things fail, but we were learned a lot. And I think Clint can talk to this, um, about some of the things he's seen. Oh, wait, sorry, I'm ahead of myself. Sorry. So, foundational agronomy gotta hit this first. So we came up with, this term seems pretty basic, but what we found is the base, the base ain't right in the farm. Some things aren't gonna work. So we need to make sure we got the foundational pieces of the farm in place. When we go start going down these, these paths and really goes back to fixing the, the physical, the chemical, and the biology of your soil. That's really where it starts out as. And when we get those right, we can start projecting things or propelling things forward. And we use, we'll talk about this a little bit later, but we use plant SAP analysis. I feel like plant SAP analysis is a steering wheel of everything we're doing. We use that to feed back into the system to understand the products and the management styles of your we're working with. And how are we doing to support this, um, intensive research, you'll probably hear from from us a lot about this in the, I know Clint's Clinton new have had added quite a bit of research power at their facility. We're we're doing the same at ours. And that allows us to have better understanding of products, solutions, whatever it is, and understand when and why to use them. Is it a court rate? Is it a pint rate? What make, what moves the needle and what is economically feasible for the grower? And like I said, investments and personnel we can take off. Yeah. So at the end of the day, you know, we're happy to partner with X extreme ag. They are basically all, all farmers who have turned their farms into research. And that's, that's really what it's all about, is, uh, finding limiting factors through basic principles and foundational issues is really what calibrated agronomy does well, and I I like this slide because you go to soil health meetings and they talk about, uh, carbon, hydrogen and oxygen making up 96% of the plant. But to the farmers that, you know, all of us that wear lots of hats, what does that mean? And I, I really think it comes down to the management of water and oxygen in our soils and managing that physical characteristic of our soil. The other piece of that is managing our carbon, our residue, and the better job we do, whether we're in a no-till environment like Kelly or like in our environment where there's a lot more tillage, uh, due to our flat geography. So when we get these principles right and we do a good job managing there, that's that everything else that a lot of these companies talked about today. Uh, efficiency products, using liquid fertility products to, uh, to truly get better, uh, at delivering when we get this right, A lot of those products have a lot better success rate at the end of the day. So this is a field, a couple fields I worked with, uh, a couple years ago. And both of these were cover crop fields. And as you can see, uh, these are the, uh, NDBI maps of these fields, but both had, uh, a co serial ride on 'em. One of the fields over here, the field on the right, uh, on the left, yeah, on the right, had great soil structure, 82 bushel beans, the field on the left, very poor soil structure, wetter feet. It was, uh, 48 bushel beans, you know, 30 some bushel difference. Same management strategy planted within the same day. So it goes back to foundational things depending on what we applied, you know, really we didn't do anything different here. It was the physical characteristics of the soil that truly changed this in a big, big way. So one of the services we offer at calibrated agronomy is historical NDBI maps. And, uh, we like these for really helping, you know, structure, uh, how we do research. And you know, this field here, uh, it has field tile underneath of it. It's a very flat, flat ground. Um, but it's got major surface drainage issues. So go next slide there, Mike. Uh, here is the same field from 2025. Uh, major, uh, had a lot of rain rainfall in 25. And just really these fields, uh, needs a lot of surface drainage issues. Um, very little slope. So eliminating the, the problem tile didn't do it alone. We need surface drainage in these fields. And one of the services we offer this for is for farmers to collect better data. Um, this is a poor field to really set up field trials. There's a, there's an area here in the middle. You can do a good job, you know, doing some field trials, but as you trial products and work with a lot of these companies out here utilizing some of these things, give it a fair shakes. You know, don't put a trial in a spot. You know, like if you're like me, you turn off your starter on the fly or you turn off your side, dress on the fly. When we look at it and plan out some of the trials we do, we're gonna give that product the best chance. Um, you know, we're truly evaluated and see what the RO i's gonna be. B So in season diagnostics, So we're gonna go over, um, kind of the tools we use in season, um, different practices we run to, uh, analyze problems that we see. So in the next slide here, um, I had a call this this summer. Um, Kelly's good friends. They farm north, north of him about an hour. He's had a, had gray leaf spot in his field. You can see on the, on your right is the disease plant. And basically these are taken down the road. Uh, I walked out this field about 70 rows and just picked a row and started walking up and down it just to see what it is. So, uh, the left is healthy plant. These are in the same row, about 30 feet apart. Um, I could walk and it just was every 30, 40 feet you get these kind of flushes to the gray leaf spot and you walk into better corn. So, uh, very high, well managed, um, crop. So I did some analysis. I went out there. I actually ended up pulling SAP analysis while I was out there. I went back, went back to the truck, grabbed the soil probe, and I pulled soil because, um, I wanted to see what the minerals were, but I also wanted to see what the biology was in the soil at the time. So you can go to the next one, Clint. Um, so I pulled the SAP analysis. This is the reports that came back. Don't, don't string your eyes looking at it. Basically virtually identical. You can go to the next one. There's a lot of information on there. But basically it came back, the only difference was silica was 40% higher in the healthy plant versus disease plant. Now the lab will tell you the silica measurement is a loose interpretation of soil biology. So basically all that said, we have better biology interaction with the plant and the healthy and the healthy plant so that soil is better. You can quote unquote guided to it. It's better and a better environment. So the next slide, these are the disease reports we get back. Um, a lot of information on here, a lot of good stuff on here. But what's mean, really what I was looking for is the next click again, Glen, is this, this is the overall thread threat assessment from this lab was, uh, on the disease profile in the soil. So if you actually look on there, on the disease plant versus the healthy plant, the disease plant soil was loaded with gray leaf spot and the healthy soil was not. So the environment of that soil, click it again, basically said, dictated that plant health. So the environment it was planted into, created the plant to be diseased. Soil was loaded with the gravely spot and it created the, created the disease triangle over there. We always talk about co competi exclusion at calibrated agronomy. And basically that's the principle of good guys versus bad guys in biology. You gotta out compete the bad guys, right? I mean, it's just a numbers game. So in that environment, we had way more bad guys than we did good guys. And the disease showed up. So we used these tools to kind of go out there and assess things when we see 'em. 'cause otherwise we just say, oh, I got gree leaf spot and I'll go plant Fung side next year. So we can make management management adjustments on these, on these, uh, problems we see in the field. You know, really today you, you heard from all these sponsors and all of 'em have, uh, a lot of effective tools. Um, and what we try to do at calibrated agronomy is collect the data first and then place the tool correctly. And that's a sense what we do, uh, is in this disease triangle, you know, we're very biologically focused, but we also evaluate synthetic products or products that get stacked like tidal grow has with, with fungicides to make them more effective. But one of the things I wanna drive home today is on mineral nutrition on this disease triangle behind me. The better job we do at Mineral Nutrition, the more he our crop is, the better our plants naturally activate its defense system, um, to protect itself. So if you guys get time after the meeting, uh, as you're, you know, re researching and furthering your, um, information, this, this winter, look into the disease triangle. 'cause there's a lot that can be, can be learned about how to grow a healthier crop. Uh, just by honing in on what our limiting factors are. Any questions? So gonna go in a short synopsis of plant sample analysis and why we use it. Uh, basically plant sample analysis is a little, quite a bit different than tissue. Tissue is a just a ash extraction. Take a take a leaf, send a lab, they dry it down, burn it up, put an ash pile and extract the nutrients out of it. Plant SAP analysis is the measure of this island flow, which are the highways and, and nutrient transport pieces of the plant. So we're actually looking at that, what the plant is moving through, through, through itself. Um, and we can get a rhythm of flow, what we like to call rhythm of flow of a plan. So here's the diagram. Um, x think of it as the train tracks. I'm gonna put something on the train and it's going one way. And that's, that's it. It's a one way direction, nothing coming back. Flow is the other way. It's more like the interstate 80 out here. You got traffic going both ways. Commerce going both ways. So that's what it's doing is taking the photosynth, taking 'em down the roots and moving 'em around the plant. And what it talks, what we talk a lot about here is nutrient mobility allows us to see that. We can see the, in the mobile nutrients deficient in in these results. Uh, your phosphorus, nitrogen chloride, potassium, those nutrients show up in these plants 'cause we're comparing the new and old growth. So we're looking at those and what else allowed us to do is look at nutrients little different. What specifically is nitrogen, um, that you can talk about this slate. Yeah, so I call this nitrogen the double-edged sword. We're 20 pounds short. It's a big deal. I mean, there's, there's major yield loss, but if we're excessively applying nitrogen, there's a lot of negatives that come from that. And usually plant health is the number one thing to, to come from that. It can also be, uh, it wants to compete with calcium and uh, potassium in the plant. And really it throws off balance in that plant health aspect. If I would say that there was one nutrient that we, when we overly it causes a negative plant health benefit, it would be nitrogen. And that is part of the value of what we're trying to do with SAP analysis. We're trying to correlate this all back to yield and find negative attributes within SAP as well as positive attributes. So this nutrient goes up, yield goes up. Okay, well, uh, the one cool thing about sap, we look at three forms of nitrogen in the plant. We look at total land that's in, uh, protein form, uh, a usable part of nitrogen for, um, for growth. But if we get excessive flow of ammonium and nitrate where it isn't assimilated to that protein, we end up usually having a, a energy drag on the plant that a lot of times, according to our data, shows a negative yield benefit. So we focus on the building blocks that need to be stacked with nitrogen, the carbon, the sulfur, the assimilation pieces. So that's how we're getting more efficient, um, and really spending a lot of time on the r and d of, of what nutrients truly drive efficiency and nitrogen. Yeah, and I'll talk about this slide. This is Kelly's data. We've, I've had a few discussions with guys here over the last, you know, 12 hours here, how to use sap. Some of you guys have tried it, some of you guys have used it and it, and it is information overloaded times, but these are the three years that sat updated on Kelly's. I think this is about four 40 samples of core on his farm over the last three years. And what you're looking at here is nitrate. And that yellow line on there for reference is 50 parts per million. That's what the lab tells you you need to be below. So when you look at this, if you look off to the, your right, that segment there, that's the new leaf. And from v from start of that corn crop to about V 12, we were above that the whole time. So it kind of goes back to what Kelly started with with that nitrate study we did with all that SW or all that nitrogen come outta the ground, it's showing up in these plants over three years. It's, it's common practice. Now we gotta figure out how to solve it, right? So if you go to the next slide, you know, this is what happens within the plant cell. This is your nitrogen process on the, on your right when nitrate ammonium come into the plant. So if nitrate shows up in the plant and it don't have the essential minerals to process it, it'll shove it in the vacuum for storage later. And when it does that, it brings along water. 'cause it needs water to replace it. So it stores it and as it accumulates, so much expands that cell plant has to divide itself and grow rank. And you get this large growth, you get nice green mush plants, but you're getting the successive growth. You're not turning that nitrogen into protein. This word becomes the unhealthy plant. So what are the challenges? I kind of alluded to your earlier information overload and we've seen that as calibrated as ourselves and the people we work with. Um, it's what's important to chase. Everybody's like the questions of, of when they get these reports, what to do, and that's the calibrated agronomy. That's what we're working on trying to solve. Um, Luke's spending a lot of time on this piece. We're trying to bring a tool to the market to help take this information and make it useful for you guys. So you get to report it, I can put it in the system, it'll give you like the top three things I need to go for without trying to read that whole list. And we're have an interface, next one, the dashboard and it'll be a web-based tool. We'll allow it, you know, access to it, put that information in there and get some, an analytics back to you in a more timely manner. We, uh, we hope to release this tool this spring. Um, we haven't come up with a name for it. Kelly, uh, Kelly has named the tool because Luke spent so much time on it. Luke's big tool. So we, we, we are not gonna lead with that. So we're got a little time to get, figure out a actual name for the tool. But, uh, at the end of the day, what this is trying to do for you guys is to be able to take all these resources we have here, uh, you know, within the Extreme Act network with all these, uh, products and use 'em more effectively. So, uh, I, I myself, we farm, uh, and have been very frustrated with SAP analysis to be, to be quite honest. And so what we have done internally, we've got over 300 sites, um, with over 3000 data points. And we basically, in that, uh, research sites, our yield ranges from 160 to 310 bushel. And then Luke runs statistical analysis on those. And we break that into what we hope is more easily digestible data than some of the in depth things we've kind of laid out here today. But we take a, a crop and we break into three segments early, middle, and late. And then we look at the order of importance of nutrients that drive yield in corn. Um, because there's, there's no need to spend money on manganese if sulfur's still out of bed. And it's still the primary driver of yield within that growth stage. And so we hope to get better at our recommendation process, uh, bring better mineral balance that all points to increased profitability. The nutrient density stuff Kelly, uh, is very passionate about. All of those things are very much converge, uh, the better job we do with mineral nutrition. That's just, uh, another screenshot, but that's all we had here, um, from us. Um, any questions? Okay, clear the back. We still workout With those three segments, you know, your beginning middle, what would you recommend somebody starting that initial SAP sample? So in that beginning period, that grow period in that finished period, where would that SAP step will be? Yeah, so for scalability of sap, because it takes a lot of time and we're all, we're all busy, you know, managing all the aspects of a farm. We, we usually, uh, recommend farmers pull, uh, what I, what, you know, an a class soil, their average dirt and then their poorer soils or their problem areas. Take a field and pull every week or every other week and build the rhythm and flow for your, you know, geography, your management style. And that has been the, the most eye-opening there is kind of pulling fields randomly ahead of applications has been left us more confused. So we'll start V three, V four, we'll pull a whole plan and then once we get to V six, we start pulling both loops. We pull old growth and new growth and how that makes you guys better. We want the root system or our soil to supply the crop with, with nutrients for as long as it can. We don't wanna ever rob, uh, an older leaf to support new growth. The better job we can keep that root system, uh, you know, building that plant nutritionally, uh, the more yield we seem to obtain. So, uh, we really like, I mean we, where we learned the most is pulling that world and new growth and learning when our mobile nutrients, which are nitrogen, potassium, phosphorus, and sulfur learning, when those start to move from the bottom of the plant up, um, I think that's probably a safe place to start a V six. But then from there we'll pull several in rapid growth, several in reproductive stages. So, good question. Any more questions? Scott has one from Ohio. Get it out there buddy. At what stage are we going to want to, or at what labs are we gonna want to do this? Are we gonna be specific on which labs we send these to or that for that reason? 'cause as we've been at other places before, we've been to certain labs that test certain ways and certain labs don't test that way. Great question. We use New Age labs in Haven, Michigan and we really recommend you go through one of our dealers, our distribution partners within, uh, calibrated Extreme ag because that is gonna, what we hope to do, uh, as a group is bring all of our findings. If we run it through the calibrated agronomy and umbrella, we hope to be able to, that gives us more data points to query, uh, and find trends within the data. And we hope to then in our, our meetings present that back to the group to, to help everybody get better. And so run through a calibrated agronomy dealer would be my recommendation. Um, and they'll, they'll help take care of getting that to, uh, new Age Laboratories in, in Michigan. Anybody else got anything? Well, I want to thank, uh, all the extreme mad guys, all the sponsors and I, you know, we, we need to give Damien Mason a round of the applause. You, you see what he did last did Great job today. He, he typically, uh, Gives everybody a hard time. So I'm gonna leave you with the nickname we use for Damien and is Damien d Money Mason is what we call him here. 00:25:55.305 --> 00:25:55.945